There is a persistent assumption in bank lending circles that small SBA loans are the safe ones — approachable deal sizes, familiar borrower profiles, lower dollar exposure if something goes wrong. The data, analyzed across 371,156 SBA 7(a) loans funded between FY2020 and FY2025, tells a more complicated story.
Charge-off risk in the 7(a) program does not decrease as loans get smaller. It increases — sharply, consistently, and at every size tier. The safest loans in the dataset are the largest ones.
The Numbers
Here is the charge-off rate by loan size across the full FY2020–FY2025 cohort:
| Loan Size | Loans Analyzed | Charged Off | Charge-Off Rate |
| Under $150K | 152,628 | 3,890 | 2.55% |
| $150K–$350K | 86,292 | 1,170 | 1.36% |
| $350K–$500K | 32,915 | 257 | 0.78% |
| $500K–$1M | 47,596 | 199 | 0.42% |
| $1M–$2M | 30,094 | 90 | 0.30% |
| $2M–$5M | 21,631 | 55 | 0.25% |
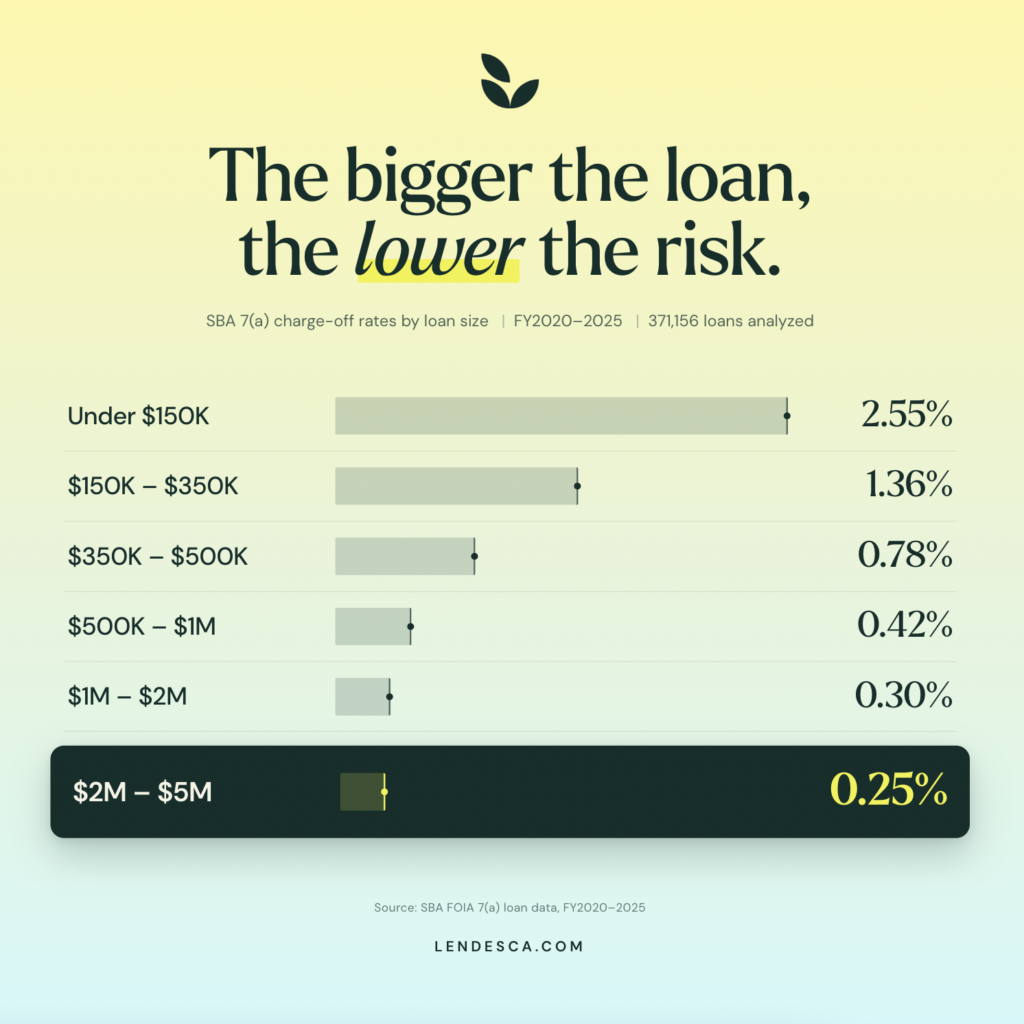
The pattern is unambiguous. A bank originating loans under $150,000 is accepting a charge-off rate more than ten times higher than a bank focused on the $2M–$5M tier. That differential persists across every fiscal year in the dataset, every business age category, and every major industry segment.
The average charged-off loan in this dataset had an original balance of $163,954. The average current loan: $511,273.
That single comparison captures the dynamic better than any rate table. Loans that go bad skew small. Loans that perform skew large. The SBA guarantee does not change the underlying credit profile of the borrower — and smaller borrowers, on average, carry more risk.
Why Does Loan Size Predict Performance?
The relationship between loan size and credit quality is not arbitrary. It reflects several structural realities about the borrower population at each tier.
Established cash flow. Borrowers seeking $2M–$5M in SBA financing are, almost by definition, operating businesses with meaningful revenue history. They have financials substantial enough to support that loan size under SBA underwriting standards — typically demonstrating a DSCR of at least 1.25x on a larger obligation. Borrowers at the sub-$150K tier include a significantly higher proportion of startups, pre-revenue businesses, and borrowers whose primary qualification is the SBA guarantee itself rather than demonstrated repayment capacity.
Collateral depth. Larger loans are more likely to be secured by commercial real estate, equipment, or business assets with meaningful liquidation value. Sub-$150K loans are frequently undersecured or secured primarily by personal guarantees — which have limited practical recovery value when a small business fails.
Operator sophistication. This is harder to quantify but real. Borrowers capable of navigating the documentation, financial reporting, and underwriting requirements of a $3M SBA loan tend to be more financially sophisticated than those accessing small-dollar programs. That sophistication generally correlates with better business management and lower default risk.
The Business Age Dimension
The loan size effect is real across all borrower types, but it interacts meaningfully with business age. Looking at the FY2020–FY2023 cohorts — loans with enough seasoning to show credit events — change-of-ownership transactions stand out as a case study in how loan size and business quality compound.
Change-of-ownership loans in the sub-$150K range carry a 2.26% charge-off rate. At the $2M–$5M tier, that rate is 0.84% — despite the fact that all of these are acquisition transactions, where the borrower is taking on a new business rather than operating an existing one. The size differential within a single borrower category reinforces that the loan amount itself is a meaningful proxy for deal quality, not just deal size.
Startup loans show the most acute version of this pattern. At smaller sizes, startup charge-off rates are the highest in the dataset. At larger sizes, startups that qualify represent a self-selected group of well-capitalized, well-planned ventures — and their performance reflects it.
Industry Mix at the Large-Loan Tier
One reason the $1M–$5M tier performs so well is the industry composition of deals at that size. Looking at the top industries in that range across the FY2020–FY2025 dataset:
- Hotels and motels: 0.19% charge-off rate across 2,589 loans
- Gasoline stations with convenience stores: 0.14% across 1,405 loans
- Dental offices: 0.13% across 791 loans
- Car washes: 0.00% across 497 loans
- Veterinary services: 0.00% across 365 loans
These are businesses with durable cash flows, real property collateral, and in the case of healthcare and professional services, significant operator investment in licensure and goodwill that creates strong incentives to protect the business. They happen to be the industries that most naturally produce loan requests in the $1M–$5M range.
The sub-$150K tier, by contrast, skews toward retail, food service, and service businesses with thin margins, high competition, and limited collateral. Not all of those businesses fail — the 2.55% charge-off rate means 97.45% did not — but the credit profile is structurally weaker.
What This Means for Lenders Building an SBA Program
The implications for bank SBA strategy are direct.
First, loan size mix is a credit quality lever, not just a volume decision. A bank that focuses its SBA origination on larger, well-collateralized transactions in healthcare, hospitality, and professional services is building a meaningfully lower-risk portfolio than one that chases volume through small-dollar Express loans. The guarantee covers a portion of the loss either way — but the operational cost of working through defaults, the reputational impact with SBA, and the effect on the bank’s purchase rate all favor larger, higher-quality origination.
Second, average loan size is a useful benchmark for evaluating your SBA program’s health. Across the FY2020–FY2025 dataset, current (performing) loans average $511,273. Charged-off loans average $163,954. If your portfolio average is well below the performing loan average, that is worth examining.
Third, the data does not argue that small-dollar SBA lending is wrong — it serves a genuine need and the SBA Express program exists for a reason. It does argue that banks building SBA programs around a high-volume small-dollar strategy are accepting more credit risk than the headline guarantee percentage implies, and should underwrite and monitor accordingly.
Loans that go bad skew small. Loans that perform skew large. The SBA guarantee doesn’t change the underlying credit profile of the borrower.
At Lendesca, our origination focus has always been on the larger, more complex 7(a) transactions — the deals that require deep SBA expertise, strong underwriting, and experienced execution. The data above is part of why. If you’re a bank evaluating where to focus your SBA strategy, we’d welcome the conversation.
Data source: SBA FOIA 7(a) loan-level dataset, FY2020–present, as of March 31, 2026. Analysis covers 371,156 loans with valid approval amounts in the $0–$5M range. Charge-off rates are calculated as a percent of loan count within each size bucket. FY2024 and FY2025 charge-off rates are understated relative to earlier cohorts due to insufficient seasoning — losses on recently originated loans have not yet fully emerged. All figures are Lendesca’s own analysis of publicly available SBA data.