The SBA’s annual lending data tells a clear story to those willing to read it carefully. Strip out the noise from the pandemic-era programs — PPP, COVID EIDL — and what you’re left with in the core 7(a) program is a market that is growing, concentrating rapidly in the hands of a small number of specialist lenders, and delivering better credit quality than most bank executives assume. For community and regional banks sitting on the sidelines, that combination of trends is not reassuring. It is a warning.
This post walks through what the data actually shows: the volume trajectory, who is winning the market and why, what the credit performance record looks like over the past decade, and what all of it means for banks still weighing whether to build an SBA program.
Volume: The Core 7(a) Program Is Growing
FY2025 closed with 61,268 loans approved for $28.0 billion in gross approvals under the 7(a) Regular program — the second-highest volume year in the program’s history by loan count, behind only FY2024’s 70,242 loans.
FY2024 set a volume record at 70,242 loans. FY2025 delivered 61,268 — the second-highest count on record.
FY2023 came in at 57,362 loans. FY2024 jumped to 70,242 — a 22% increase in a single year. FY2025 closed at 61,268 loans for $28.0 billion, down modestly from FY2024’s peak but still the second-highest volume year on record and well above any pre-2024 year. Average loan size was approximately $478,000, reflecting a healthy mix of small-dollar Express loans and larger PLP transactions. The program’s long-term growth trajectory is intact.
Lender Concentration: A Market That Is Thinning at the Top
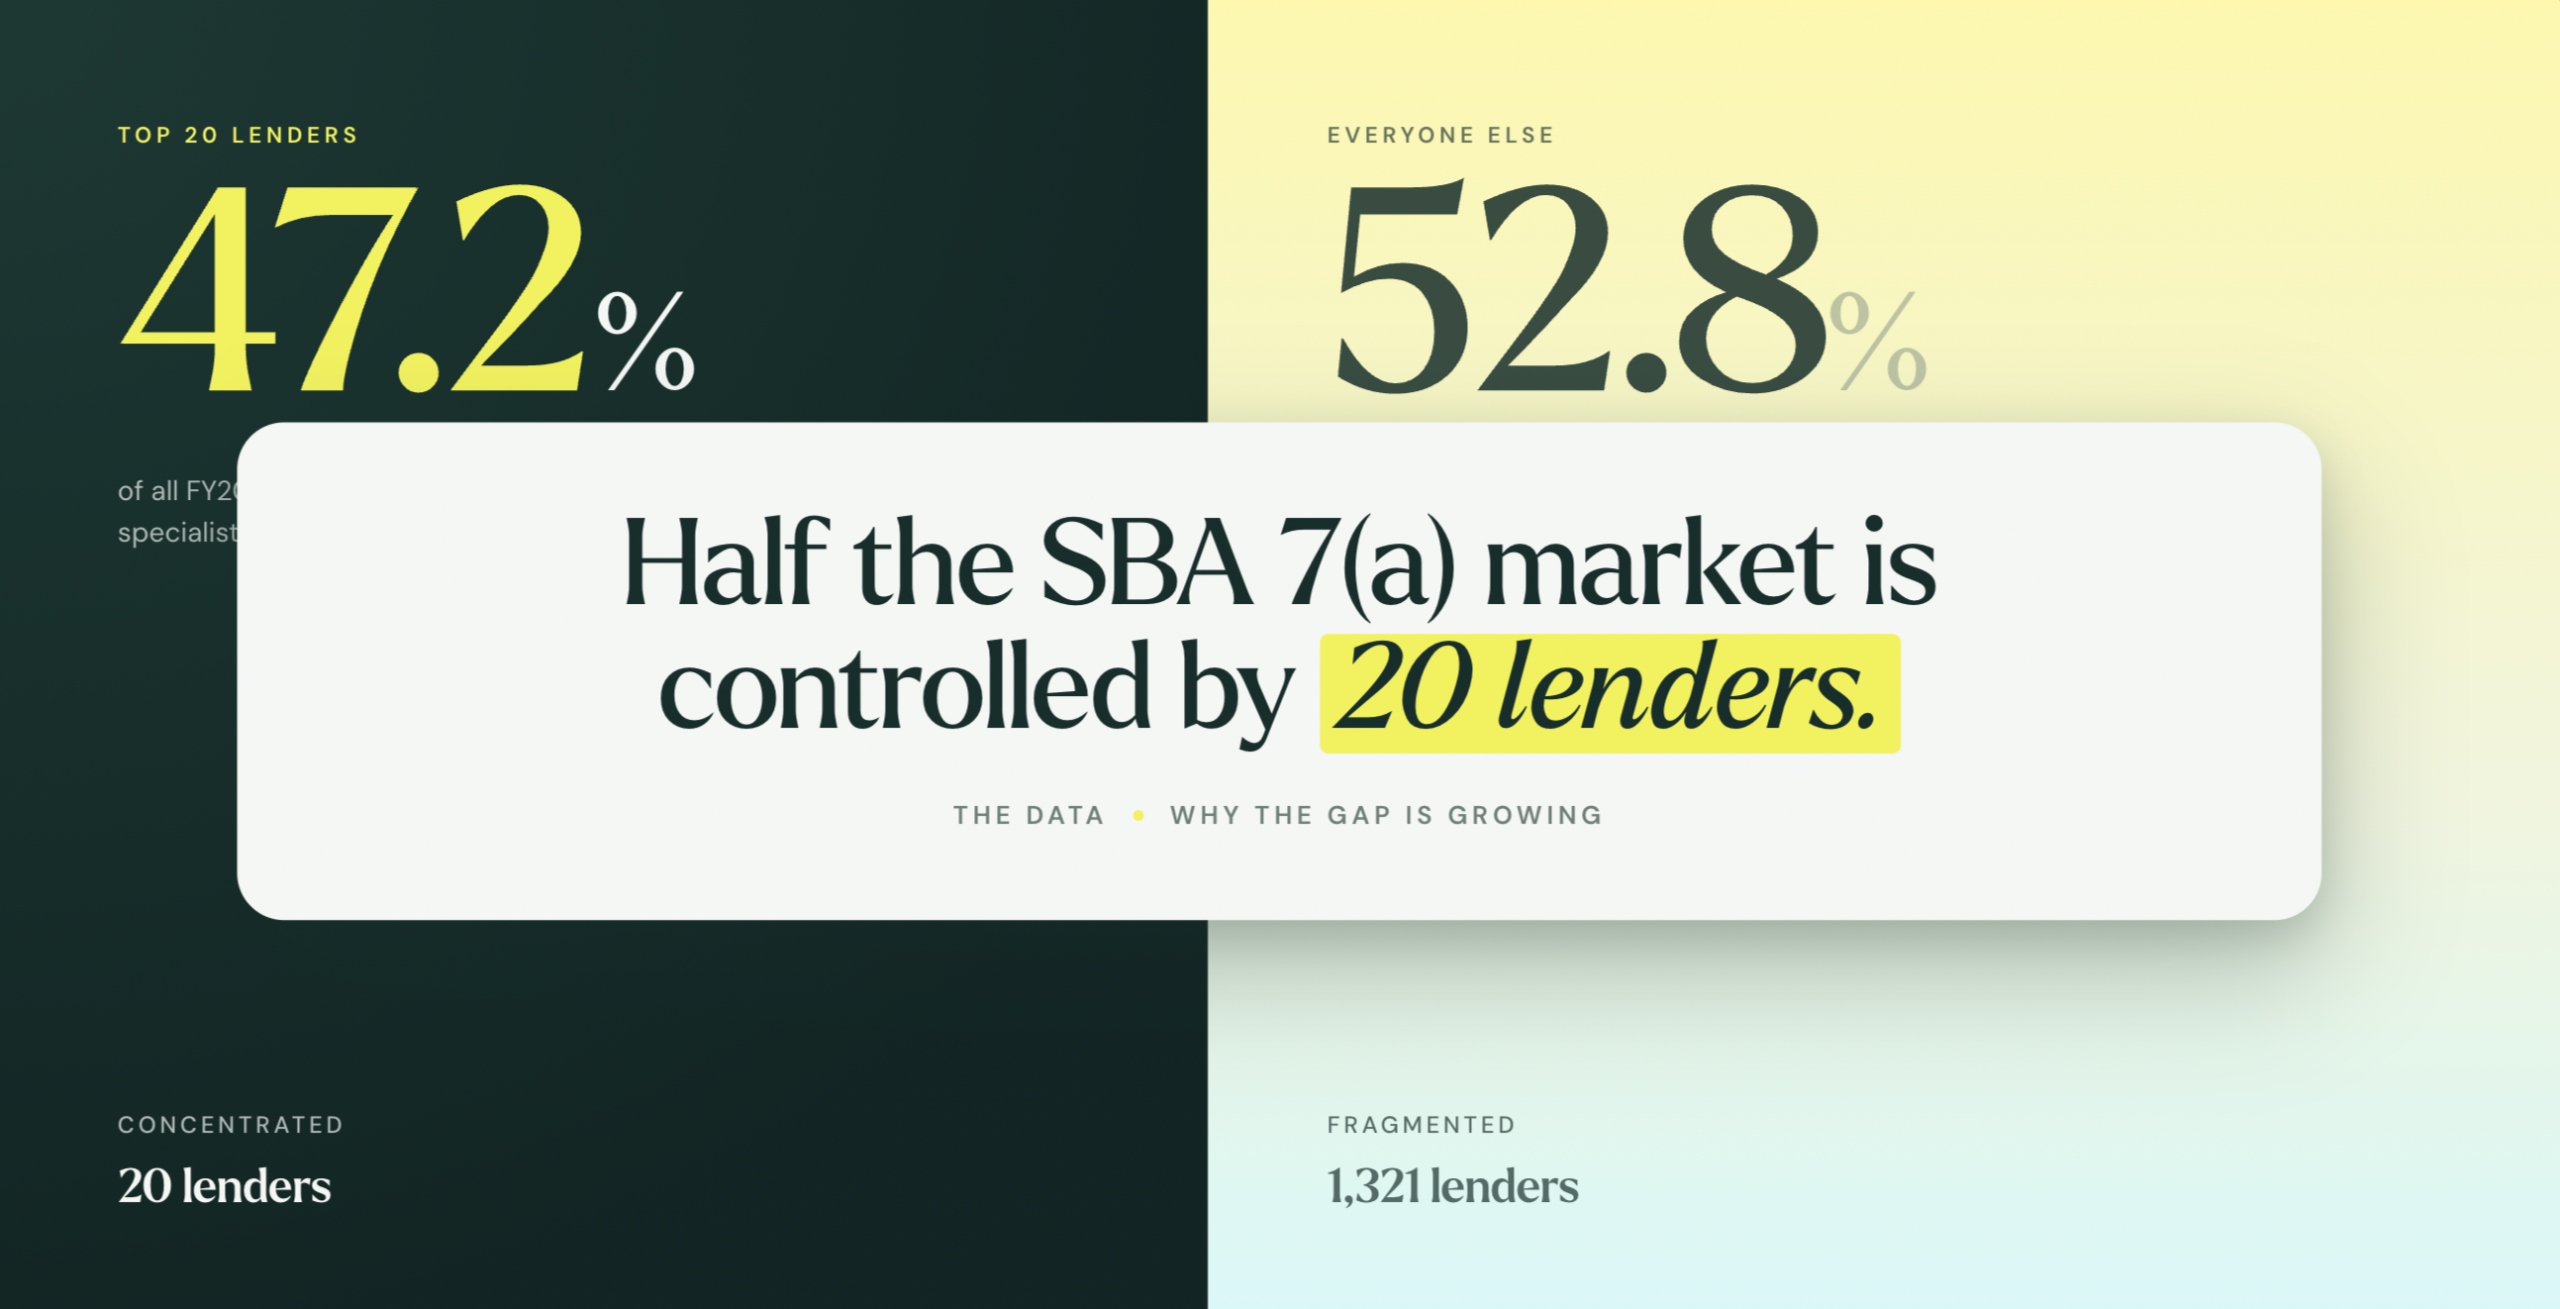
Here is the data point that should concern every bank executive who has not yet built an SBA capability: in FY2025, the top 20 lenders by origination volume captured 47.2% of all 7(a) dollars. The top 10 captured 35.4%. The top 5 — Live Oak Bank, Huntington National Bank, Newtek Bank, Northeast Bank, and Readycap Lending — accounted for 26.4% of the entire market.
That top-five concentration is not an accident. Each of those institutions has made a deliberate, multi-year investment in SBA as a core business: dedicated origination teams, purpose-built technology, deep SBA Operations Center relationships, and in most cases a significant loan sale premium strategy that monetizes the guaranteed portion in the secondary market. They are not dabbling.
The rest of the market — 1,321 lenders sharing the remaining 52.8% of volume — is fragmented and, increasingly, shrinking. Active 7(a) lenders peaked around 1,497 in FY2021 and have declined to 1,341 in FY2025. More telling: 711 of those 1,341 lenders made five or fewer 7(a) loans in the entire fiscal year. Another 376 made between 6 and 25. Only 93 lenders made more than 100 loans.
711 of 1,341 active 7(a) lenders made five or fewer loans in all of FY2025. Volume is consolidating fast.
The picture this paints is one of bifurcation. A small cohort of specialist lenders is pulling away from the field — building flywheel advantages in processing speed, borrower acquisition, and secondary market execution — while the majority of participants remain in a subscale position that limits both profitability and competitive positioning. The lenders in the middle — those making 26 to 100 loans per year — are the most vulnerable: large enough to have meaningful overhead, not large enough to achieve the operational efficiency of the leaders.
For community banks evaluating their options, this concentration story cuts both ways. The bad news is that the window for building a differentiated SBA capability organically, from scratch, is narrowing. The good news is that more than half the market is still served by non-specialist lenders, and demand is growing. The question is how quickly a bank can reach the scale and execution quality necessary to compete effectively.
Processing Methods: Where the Real Volume Lives
Understanding where volume is actually being generated requires looking at how loans are processed. In FY2025, the Preferred Lenders Program (PLP) dominated: 50,081 loans for $31.4 billion, with an average loan size of $626,000. PLP status — which allows lenders to approve loans without prior SBA review — is earned through demonstrated track record and portfolio performance. It is not available to new or low-volume lenders.
SBA Express, which allows loans up to $500,000 with an expedited review process, accounted for 24,155 loans but only $2.6 billion — reflecting its $500,000 cap and average loan size of just $106,000. Express is a volume driver for small-dollar lending, particularly for banks targeting Main Street borrowers, but it does not move the needle on dollar production.
The implication is direct: banks that want to be meaningful players in 7(a) need PLP status. That requires a minimum volume history and a clean performance record. There is no shortcut. Which is why the specialist lenders at the top of the concentration table have a durable structural advantage — they already have it, and maintaining it costs them very little.
Credit Quality: The Data Tells a Different Story Than the Reputation
SBA 7(a) has a reputation problem in some bank boardrooms. The perception — largely rooted in the catastrophic charge-off cycle that followed the 2008 financial crisis — is that these are high-risk loans with correspondingly high loss rates. The decade of data now available from the SBA’s annual performance reports tells a different story.
The 7(a) Regular charge-off rate as a percent of unpaid principal balance (UPB) peaked at 1.82% in FY2016 — still working through post-crisis losses from loans originated in 2006 through 2009. Since then, it has declined consistently: 0.80% in FY2017, 0.51% in FY2018, and has ranged between 0.36% and 0.55% from FY2019 through FY2025. The FY2025 rate through Q3 is 0.37%.
The 7(a) Regular charge-off rate has run between 0.36% and 0.55% every year since FY2019 — comparable to or better than most conventional commercial loan portfolios.
For context, the Federal Reserve’s charge-off data for all commercial and industrial loans at commercial banks has historically run in a similar range during non-recessionary periods, often between 0.3% and 0.8%. The notion that SBA 7(a) is dramatically riskier than conventional commercial lending is not supported by the actual performance data from the last six years.
The purchase rate — which measures how often SBA must step in to honor its guarantee when a borrower defaults — shows a similar pattern. For 7(a) Regular, the purchase rate ran between 0.57% and 1.00% from FY2019 through FY2023, ticked up to 1.43% in FY2024, and came in at 1.37% for FY2025. The FY2024 and FY2025 uptick is worth watching, but is consistent with a broader tightening of small business credit conditions rather than a systemic problem with the SBA program specifically.
The recovery story adds additional context. For every cohort of 7(a) Regular loans charged off from FY2016 through FY2023, cumulative post-charge-off recoveries via the Treasury Cross Servicing program have ranged from 2.68% of charged-off principal (for the FY2016 cohort, which is still in recovery) to 6.65% (FY2018 cohort). Total recovery rates — which include all collections on purchased loans — have been even higher, running between 23% and 39% of the original purchase amount for cohorts with sufficient history.
What this means practically: the SBA guarantee is not the only protection a lender has. Collateral recovery and Treasury collections meaningfully reduce the net loss on defaults, and the historical data demonstrates that these recovery mechanisms actually function.
Who Is Borrowing: The Industry and Business Profile
The FOIA loan-level data provides a detailed picture of where 7(a) capital is actually going. In FY2025, the top five industries by dollar volume were hotels and motels ($2.0 billion), full-service restaurants ($1.8 billion), limited-service restaurants ($1.2 billion), gasoline stations with convenience stores ($1.1 billion), and child care services ($832 million).
The dominance of hospitality, food service, and convenience retail is not new — these industries have anchored SBA 7(a) originations for years. What is notable is the sustained demand from healthcare-adjacent sectors: dental offices ($739 million), physician offices ($455 million), and veterinary services ($434 million) all appear in the top 15. These are cash-flow-stable businesses with strong collateral profiles and professional borrowers who are generally well-suited to SBA underwriting.
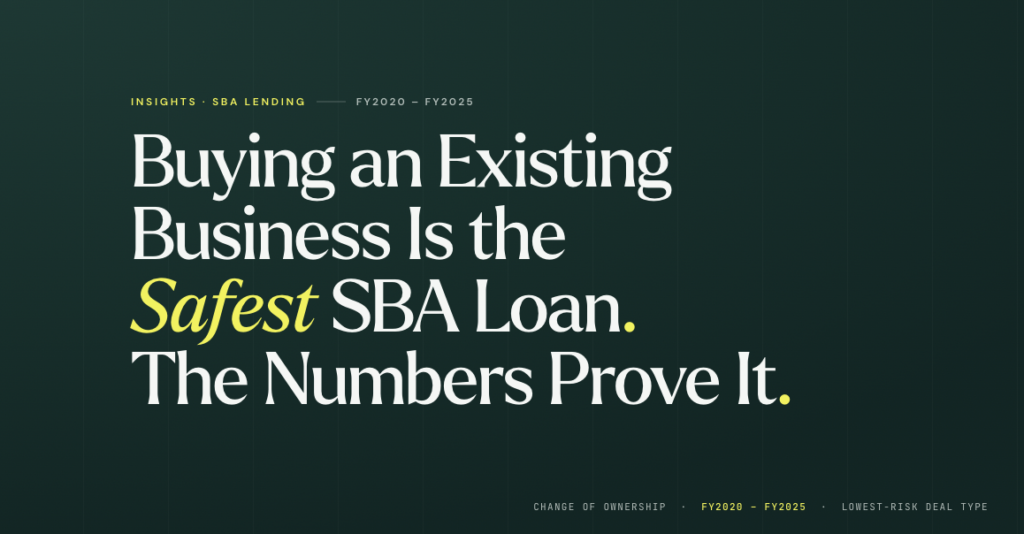
On the borrower profile side, 60.4% of FY2025 loans went to existing businesses operating more than two years. Another 15.2% went to businesses two years old or less, 14.6% to true startups, and 9.6% to change-of-ownership transactions. The change-of-ownership segment — SBA financing for business acquisitions — has been a consistent growth area, driven by the accelerating wave of baby boomer business owner retirements and the lack of conventional financing options for acquisition transactions at small business scale.
Geographically, California ($4.8 billion), Texas ($4.1 billion), and Florida ($3.2 billion) account for roughly 32% of all FY2025 7(a) volume, consistent with their share of overall small business activity. Average loan sizes vary meaningfully by state — Texas loans average $646,000 against New York’s $345,000 — reflecting differences in industry mix and real estate collateral values.
The Portfolio Health Snapshot
Looking across the 304,590 funded loans in the FOIA dataset (FY2020–present, excluding 45,667 cancelled loans and 23,724 commitments not yet disbursed), the current portfolio health indicators are constructive. Of funded loans, 70.6% are current, 20.3% have paid in full, 3.0% have been purchased by SBA but not yet charged off, 1.9% are in liquidation, 2.1% are delinquent or past due, and 1.9% have been charged off.
The combined delinquency and liquidation rate of approximately 3.8% (2.1% delinquent or past due, 1.9% in liquidation) is consistent with what one would expect for a small business lending portfolio in the current rate environment. It is not a stress signal. The charge-off rate of 1.9% across the funded post-2020 cohort reflects both the credit events since then and the fact that losses take time to fully emerge, particularly for loans originated in 2022 and 2023 when the rate environment was rapidly changing.
The caveat worth stating plainly: the FY2024 and FY2025 purchase rate data suggest that borrower stress is real and modestly elevated. Small businesses have been absorbing higher rates, higher labor costs, and softening consumer demand simultaneously. This is not unique to SBA-guaranteed loans — it is the broader small business credit environment — but it is a factor that lenders should monitor in their underwriting standards and portfolio surveillance.
What This Means for Banks on the Sidelines
The data makes a specific argument, and it is worth stating directly.
First, the core 7(a) program is healthy and growing. FY2025 closed as the second-highest volume year in program history. Demand from small business borrowers is not weakening. The program’s credit performance over the past six years compares favorably to conventional commercial lending, and the SBA guarantee meaningfully limits loss exposure when loans do go wrong.
Second, the market is concentrating. The specialist lenders at the top of the league table are building structural advantages that compound over time: PLP status, secondary market relationships, origination technology, and borrower referral networks. Every year a bank waits is a year those advantages deepen.
Third, more than half the market is still served by non-specialist participants. The opportunity is real. But capturing it requires either building the capability organically — which is slow, expensive, and increasingly difficult — or partnering with an originating LSP that can provide the full loan lifecycle infrastructure without requiring the bank to build it from scratch.
At Lendesca, we built our platform specifically for this moment: banks that want access to the 7(a) market’s risk-adjusted returns without the cost and complexity of standing up an internal SBA department. The data above is the case for why that matters. If you’re a bank executive evaluating your SBA strategy, we’d welcome the conversation.
Data sources: SBA WDS Annual Performance Reports (FY2016–FY2025, as of June 30, 2025); SBA FOIA 7(a) loan-level dataset (FY2020–present, as of March 31, 2026). WDS data as of June 30, 2025 covers the first three quarters of FY2025; full-year FOIA loan-level data runs through March 31, 2026. FOIA dataset includes 373,981 total loan records; portfolio health percentages are calculated on the 304,590 funded loan base (excluding cancelled and uncommitted loans). All charge-off and recovery rates reflect the SBA-guaranteed portion only.